30. QoS Scheduler Sample Application
The QoS sample application demonstrates the use of the DPDK to provide QoS scheduling.
30.1. Overview
The architecture of the QoS scheduler application is shown in the following figure.
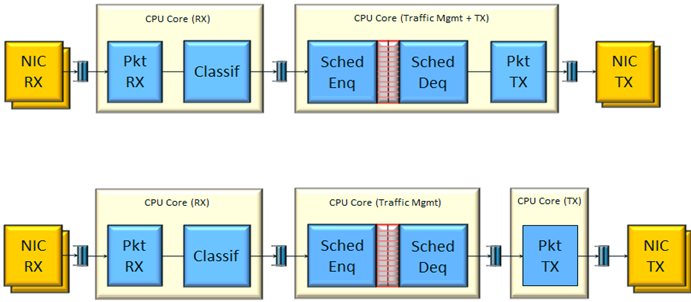
Fig. 30.1 QoS Scheduler Application Architecture
There are two flavors of the runtime execution for this application, with two or three threads per each packet flow configuration being used. The RX thread reads packets from the RX port, classifies the packets based on the double VLAN (outer and inner) and the lower byte of the IP destination address and puts them into the ring queue. The worker thread dequeues the packets from the ring and calls the QoS scheduler enqueue/dequeue functions. If a separate TX core is used, these are sent to the TX ring. Otherwise, they are sent directly to the TX port. The TX thread, if present, reads from the TX ring and write the packets to the TX port.
30.2. Compiling the Application
To compile the sample application see Compiling the Sample Applications.
The application is located in the qos_sched sub-directory.
Note
This application is intended as a linux only.
Note
To get statistics on the sample app using the command line interface as described in the next section,
DPDK must be compiled defining RTE_SCHED_COLLECT_STATS, which can be done by changing the relevant
entry in the config/rte_config.h file.
30.3. Running the Application
Note
In order to run the application, a total of at least 4 G of huge pages must be set up for each of the used sockets (depending on the cores in use).
The application has a number of command line options:
./<build_dir>/examples/dpdk-qos_sched [EAL options] -- <APP PARAMS>
Mandatory application parameters include:
- –pfc “RX PORT, TX PORT, RX LCORE, WT LCORE, TX CORE”: Packet flow configuration. Multiple pfc entities can be configured in the command line, having 4 or 5 items (if TX core defined or not).
Optional application parameters include:
- -i: It makes the application to start in the interactive mode. In this mode, the application shows a command line that can be used for obtaining statistics while scheduling is taking place (see interactive mode below for more information).
- –mnc n: Main core index (the default value is 1).
- –rsz “A, B, C”: Ring sizes:
- A = Size (in number of buffer descriptors) of each of the NIC RX rings read by the I/O RX lcores (the default value is 128).
- B = Size (in number of elements) of each of the software rings used by the I/O RX lcores to send packets to worker lcores (the default value is 8192).
- C = Size (in number of buffer descriptors) of each of the NIC TX rings written by worker lcores (the default value is 256)
- –bsz “A, B, C, D”: Burst sizes
- A = I/O RX lcore read burst size from the NIC RX (the default value is 64)
- B = I/O RX lcore write burst size to the output software rings, worker lcore read burst size from input software rings,QoS enqueue size (the default value is 64)
- C = QoS dequeue size (the default value is 32)
- D = Worker lcore write burst size to the NIC TX (the default value is 64)
- –msz M: Mempool size (in number of mbufs) for each pfc (default 2097152)
- –rth “A, B, C”: The RX queue threshold parameters
- A = RX prefetch threshold (the default value is 8)
- B = RX host threshold (the default value is 8)
- C = RX write-back threshold (the default value is 4)
- –tth “A, B, C”: TX queue threshold parameters
- A = TX prefetch threshold (the default value is 36)
- B = TX host threshold (the default value is 0)
- C = TX write-back threshold (the default value is 0)
- –cfg FILE: Profile configuration to load
Refer to DPDK Getting Started Guide for general information on running applications and the Environment Abstraction Layer (EAL) options.
The profile configuration file defines all the port/subport/pipe/traffic class/queue parameters needed for the QoS scheduler configuration.
The profile file has the following format:
; Port configuration
[port]
frame overhead = 24
number of subports per port = 1

; Subport configuration
[subport 0]
number of pipes per subport = 4096
queue sizes = 64 64 64 64 64 64 64 64 64 64 64 64 64

subport 0-8 = 0                ; These subports are configured with subport profile 0

[subport profile 0]
tb rate = 1250000000           ; Bytes per second
tb size = 1000000              ; Bytes

tc 0 rate = 1250000000         ; Bytes per second
tc 1 rate = 1250000000         ; Bytes per second
tc 2 rate = 1250000000         ; Bytes per second
tc 3 rate = 1250000000         ; Bytes per second
tc 4 rate = 1250000000         ; Bytes per second
tc 5 rate = 1250000000         ; Bytes per second
tc 6 rate = 1250000000         ; Bytes per second
tc 7 rate = 1250000000         ; Bytes per second
tc 8 rate = 1250000000         ; Bytes per second
tc 9 rate = 1250000000         ; Bytes per second
tc 10 rate = 1250000000        ; Bytes per second
tc 11 rate = 1250000000        ; Bytes per second
tc 12 rate = 1250000000        ; Bytes per second

tc period = 10                 ; Milliseconds

pipe 0-4095 = 0                ; These pipes are configured with pipe profile 0

; Pipe configuration
[pipe profile 0]
tb rate = 305175               ; Bytes per second
tb size = 1000000              ; Bytes

tc 0 rate = 305175             ; Bytes per second
tc 1 rate = 305175             ; Bytes per second
tc 2 rate = 305175             ; Bytes per second
tc 3 rate = 305175             ; Bytes per second
tc 4 rate = 305175             ; Bytes per second
tc 5 rate = 305175             ; Bytes per second
tc 6 rate = 305175             ; Bytes per second
tc 7 rate = 305175             ; Bytes per second
tc 8 rate = 305175             ; Bytes per second
tc 9 rate = 305175             ; Bytes per second
tc 10 rate = 305175            ; Bytes per second
tc 11 rate = 305175            ; Bytes per second
tc 12 rate = 305175            ; Bytes per second

tc period = 40                ; Milliseconds

tc 12 oversubscription weight = 1

tc 12 wrr weights = 1 1 1 1

; RED params per traffic class and color (Green / Yellow / Red)
[red]
tc 0 wred min = 48 40 32
tc 0 wred max = 64 64 64
tc 0 wred inv prob = 10 10 10
tc 0 wred weight = 9 9 9

tc 1 wred min = 48 40 32
tc 1 wred max = 64 64 64
tc 1 wred inv prob = 10 10 10
tc 1 wred weight = 9 9 9

tc 2 wred min = 48 40 32
tc 2 wred max = 64 64 64
tc 2 wred inv prob = 10 10 10
tc 2 wred weight = 9 9 9

tc 3 wred min = 48 40 32
tc 3 wred max = 64 64 64
tc 3 wred inv prob = 10 10 10
tc 3 wred weight = 9 9 9

tc 4 wred min = 48 40 32
tc 4 wred max = 64 64 64
tc 4 wred inv prob = 10 10 10
tc 4 wred weight = 9 9 9

tc 5 wred min = 48 40 32
tc 5 wred max = 64 64 64
tc 5 wred inv prob = 10 10 10
tc 5 wred weight = 9 9 9

tc 6 wred min = 48 40 32
tc 6 wred max = 64 64 64
tc 6 wred inv prob = 10 10 10
tc 6 wred weight = 9 9 9

tc 7 wred min = 48 40 32
tc 7 wred max = 64 64 64
tc 7 wred inv prob = 10 10 10
tc 7 wred weight = 9 9 9

tc 8 wred min = 48 40 32
tc 8 wred max = 64 64 64
tc 8 wred inv prob = 10 10 10
tc 8 wred weight = 9 9 9

tc 9 wred min = 48 40 32
tc 9 wred max = 64 64 64
tc 9 wred inv prob = 10 10 10
tc 9 wred weight = 9 9 9

tc 10 wred min = 48 40 32
tc 10 wred max = 64 64 64
tc 10 wred inv prob = 10 10 10
tc 10 wred weight = 9 9 9

tc 11 wred min = 48 40 32
tc 11 wred max = 64 64 64
tc 11 wred inv prob = 10 10 10
tc 11 wred weight = 9 9 9

tc 12 wred min = 48 40 32
tc 12 wred max = 64 64 64
tc 12 wred inv prob = 10 10 10
tc 12 wred weight = 9 9 9
30.3.1. Interactive mode
These are the commands that are currently working under the command line interface:
- Control Commands
- –quit: Quits the application.
- General Statistics
- stats app: Shows a table with in-app calculated statistics.
- stats port X subport Y: For a specific subport, it shows the number of packets that went through the scheduler properly and the number of packets that were dropped. The same information is shown in bytes. The information is displayed in a table separating it in different traffic classes.
- stats port X subport Y pipe Z: For a specific pipe, it shows the number of packets that went through the scheduler properly and the number of packets that were dropped. The same information is shown in bytes. This information is displayed in a table separating it in individual queues.
- Average queue size
All of these commands work the same way, averaging the number of packets throughout a specific subset of queues.
Two parameters can be configured for this prior to calling any of these commands:
- qavg n X: n is the number of times that the calculation will take place. Bigger numbers provide higher accuracy. The default value is 10.
- qavg period X: period is the number of microseconds that will be allowed between each calculation. The default value is 100.
The commands that can be used for measuring average queue size are:
- qavg port X subport Y: Show average queue size per subport.
- qavg port X subport Y tc Z: Show average queue size per subport for a specific traffic class.
- qavg port X subport Y pipe Z: Show average queue size per pipe.
- qavg port X subport Y pipe Z tc A: Show average queue size per pipe for a specific traffic class.
- qavg port X subport Y pipe Z tc A q B: Show average queue size of a specific queue.
30.3.2. Example
The following is an example command with a single packet flow configuration:
./<build_dir>/examples/dpdk-qos_sched -l 1,5,7 -n 4 -- --pfc "3,2,5,7" --cfg ./profile.cfg
This example uses a single packet flow configuration which creates one RX thread on lcore 5 reading from port 3 and a worker thread on lcore 7 writing to port 2.
Another example with 2 packet flow configurations using different ports but sharing the same core for QoS scheduler is given below:
./<build_dir>/examples/dpdk-qos_sched -l 1,2,6,7 -n 4 -- --pfc "3,2,2,6,7" --pfc "1,0,2,6,7" --cfg ./profile.cfg
Note that independent cores for the packet flow configurations for each of the RX, WT and TX thread are also supported, providing flexibility to balance the work.
The EAL coremask/corelist is constrained to contain the default main core 1 and the RX, WT and TX cores only.
30.4. Explanation
The Port/Subport/Pipe/Traffic Class/Queue are the hierarchical entities in a typical QoS application:
- A subport represents a predefined group of users.
- A pipe represents an individual user/subscriber.
- A traffic class is the representation of a different traffic type with a specific loss rate, delay and jitter requirements; such as data voice, video or data transfers.
- A queue hosts packets from one or multiple connections of the same type belonging to the same user.
The traffic flows that need to be configured are application dependent. This application classifies based on the QinQ double VLAN tags and the IP destination address as indicated in the following table.
| Level Name | Siblings per Parent | QoS Functional Description | Selected By |
|---|---|---|---|
| Port | Ethernet port | Physical port | |
| Subport | Config (8) | Traffic shaped (token bucket) | Outer VLAN tag |
| Pipe | Config (4k) | Traffic shaped (token bucket) | Inner VLAN tag |
| Traffic Class | 13 | TCs of the same pipe services in strict priority | Destination IP address (0.0.0.X) |
| Queue | High Priority TC: 1, Lowest Priority TC: 4 | Queue of lowest priority traffic class (Best effort) serviced in WRR | Destination IP address (0.0.0.X) |
Please refer to the “QoS Scheduler” chapter in the DPDK Programmer’s Guide for more information about these parameters.